Introduction to Data Science: Tools and Techniques for Analysis

Imagine we have a complex puzzle to assemble and don’t know what the final result looks like. Data science can help us solve that puzzle by utilizing special tools and techniques such that different pieces put together make sense and can result in a clear and meaningful picture.
Data science allows us to make better decisions and solve complex problems. Companies enhance their products and services by utilizing data science to learn what customers like and dislike. Doctors analyze patients’ data and develop improved therapies for ailments. Even in ordinary life, data science is behind personalized suggestions on streaming services or social media, assisting viewers in discovering content they might appreciate.
In this introduction to data science you will see how data science discovers hidden patterns, anticipates future occurrences, and gets important insights from the mountains of data surrounding us in our modern society. It converts raw data into valuable knowledge to help us improve our lives. The raw input data consists of features, often referred to as independent variables, and the valuable knowledge is the model’s target, commonly referred to as a dependent variable.
This blog discusses the fundamental techniques and tools used in data analysis and offers an introduction to data science.
Data science process
Before looking at the various techniques and tools used in data science, let’s start with the fundamental data science process. The data science process involves an iterative process that helps data scientists gain an understanding of data. The typical steps involved in data science are the following:
— Data collection: This initial step collects data from various methods and techniques. We can collect it through databases, spreadsheets, application programming interface (APIs), images, and videos and from various sensors. It is crucial to ensure data accuracy, as it directly affects the integrity of the subsequent analysis. Apart from accuracy, ethical considerations, such as privacy and consent, also need to be considered at this stage.
— Preprocessing: This step involves cleaning, transforming, and organizing the raw data to make it suitable for analysis.
— Exploratory data analysis (EDA): This step examines the data to understand its characteristics. Key objectives of EDA include the following:
- Identifying the distribution across different input variables.
- Detecting patterns and trends to uncover relationships and trends between variables.
— Modeling: This step involves applying data-driven algorithms and techniques to build a model that captures the patterns, relationships, and insights in the data. The process typically involves:
- Selecting an appropriate algorithm based on the nature of the problem and the available data.
- Training the model to make predictions or identify patterns.
- Tuning algorithm parameters to optimize the model’s performance.
— Evaluation: After training the selected model, it’s time to evaluate the performance and effectiveness of the model. This involves selecting appropriate evaluation metrics based on the nature of the problem and evaluating the model’s performance to test if the predictions align with the actual outcomes.
— Deployment: After validating the model, we are ready to deploy it to real-world applications. This involves mainly integrating the model into existing systems and setting up the monitoring system to track the model’s performance in the production phase continuously. This also provides an effective feedback loop that helps improve the model’s performance and usefulness over time.
Techniques for analysis in data science
Data science utilizes diverse techniques to empower professionals to gain insights and make informed decisions from raw data. These techniques help understand relationships between variables and extract meaningful information from complex datasets.
Preprocessing
Several techniques are commonly used to clean, transform, and organize data. Some of the key techniques include the following:
- Handling duplicates and missing data: This removes duplicates, and interpolates missing values in the dataset so that the available data is consistent.
- Feature scaling: This ensures that different input variables are on a similar scale. This gives all input features the same consideration during the learning process.
- Encoding categorical variables: The categorical data is encoded into a numerical format to facilitate these variables in the analysis.
Exploratory data analysis (EDA)
It’s often helpful to visualize the dataset to understand the distribution of the dataset. Additionally, the correlation between variables helps identify potential areas of interest for further analysis. Some key techniques used in EDA include the following:
— Summary statistics: Measures of central tendency such as mean, median, and mode of the dataset provide good insights into the basic characteristics and patterns within data.
— Data visualization: This provides a powerful way to capture the full complexity of a dataset. Plots like histograms, box plots, and scatter plots reveal patterns and outliers within data.
- Histograms are useful for grouping data values into bins and visualizing the distribution.
- Box plots show summary statistics and help identify the outliers in the dataset that might require further investigation.
- Scatter plots help show the relationship between two variables. This is particularly helpful in identifying correlated variables and eventually helps in selecting the relevant features that are most informative for the analysis. This process is commonly known as feature selection.
Modeling
Machine learning techniques are crucial for predictive and descriptive modeling in data science. The following are some of the most common models used in machine learning:
- Regression: This is a process of modeling the relationship between one or more independent variables and a dependent variable. Regression models help understand how changes in one variable lead to changes in another. Regression analysis is commonly used in finance to predict stock prices or market trends, estimate medical costs, and forecast sales revenue.
- Classification: The process of assigning a label or category to a given input based on its traits or attributes is known as classification. Classification is commonly used in image recognition, spam detection, and sentiment analysis.
- Clustering: The process of grouping similar data points based on certain characteristics is known as clustering. This helps identify inherent patterns within a dataset. Unlike classification, clustering is an unsupervised learning technique that doesn’t involve predefined class labels. Clustering is commonly employed in customer segmentation, anomaly detection, and pattern recognition.
Model evaluation
Evaluating the performance of a model is crucial in ensuring its accuracy and generalizability. The following are the standard techniques used for model evaluation and validation:
- Cross-validation: This is used to evaluate and validate the performance of a model on unseen data. In data science, we partition the dataset into multiple subsets. We then use different subsets to train and test the model to assess the model’s generalization performance. Cross-validation helps prevent overfitting, where a model performs very well on the training data but poorly on new unseen data.
- Error metrics: They are commonly used in regression analysis to measure the accuracy of the model. They quantify the difference between predicted and actual values and help access the quality of the regression model. Commonly used error metrics are mean square error (MSE), mean absolute error (MAE), and root mean square error (RMSE).
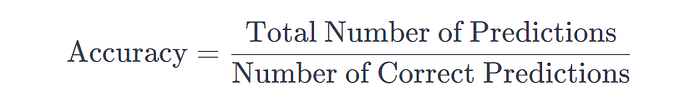
- Accuracy: This measures the proportion of correctly predicted instances out of the total instances in a dataset. It provides a basic overview of how well a machine learning model is performing. We can calculate accuracy as follows:
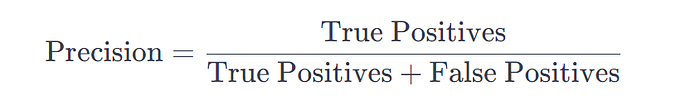
- Precision: This measure is used in classification tasks that focus on the accuracy of positive predictions. It quantifies the proportion of instances that were correctly predicted as positive out of all instances that the model predicted as positive. Assuming a binary classification problem, we can calculate precision as follows:
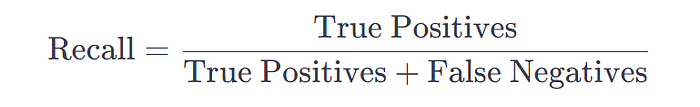
- Recall: In contact with precision, recall focuses on the effectiveness of positive predictions. It quantifies the proportion of the instances that were correctly predicted as positive out of all instances that were actually positive. Assuming a binary classification problem, we can calculate recall as follows:
Tools for data science
Now, let’s look at the common libraries and software that enable data scientists to process, manipulate, analyze, and derive insights from datasets. There are several tools that facilitate various stages of the data science process, starting from data collection and preprocessing to performing statistical analysis, data visualization, and finally to modeling.
Data collection and preprocessing
— Python: This is a popular programming language that provides the following libraries for data scraping and web crawling:
- Beautiful Soup
- Scrapy
— Additionally, Python also provides the following libraries for data manipulation:
- pandas
- NumPy
— R: This is another programming language commonly used in data science. Rcrawler is a popular R package used for domain-based web crawling and content scraping. Additionally, R also provides the following libraries which are mainly used for data manipulation:
- dplyr
- janitor
Statistical analysis
— Python: The following are the popular libraries in Python for statistical analysis:
- SciPy
- statsmodels
- pandas
— R: Provides built-in statistical functions and libraries like dplyr for advanced analysis.
— Apache Spark: This is an open-source, distributed computing framework that is widely used for data analysis and machine learning.
Data visualization
— Python: Matplotlib is a 2D plotting library for Python. It additionally provides a Seaborn library that is built on top of Matplotlib.
— R: ggplot2 is a powerful data visualization package in R.
— Tableau: This is a popular tool for creating interactive visualizations.
— Power BI: This is Microsoft’s business analytics service used for interactive data visualization.
Modeling
— Python: The following are the libraries famous for building and training machine learning and deep learning algorithms:
- scikit-learn
- TensorFlow
- Keras
- PyTorch
— R: The following are the R libraries that are excellent for statistical modeling and machine learning:
- caret
- randomForest
- Glmnet
Further reading
This blog has covered several techniques and tools commonly used in data science. To see these techniques in action, we encourage you to go through the following Educative courses that should provide you with hands-on experience performing analysis on the input features, visualizing data, and implementing machine learning models.
Happy learning!